Run a Bet in 5 Stages: Structured Decision Making for Founders
Founder playbook: run a bet in five stages, log six journal fields, and use a 30 and 90 day plan to improve calibration and outcomes.

On this page
- What Is Structured Decision Making in a Decision Journal?
- Core Elements: The Six Fields Every Entry Needs
- How to Run a Bet From Idea to Decided
- How to Start: Template, Tools, and a 30/90-Day Plan
- Calibration: Measuring Accuracy and Avoiding Bias
- Rituals That Make It a Team Habit
- How This Compares to Decision Trees and Multi-Criteria Analysis
- Structured Decision Making in Practice Across Industries
- Where Data and Analytics Fit In
- Common Obstacles and How to Get Past Them
- Adapting It for Yourself vs. Your Whole Team
- Metrics That Actually Show Improvement
- Why I Think Most Founders Get the First 90 Days Wrong
- Try the Workflow This Article Describes
- Sources
- FAQ
Structured decision making, in practice, means keeping a decision journal and treating every call as a bet: you write down what you expect to happen and how confident you are before you know the outcome. For founders and small teams, the payoff is calibration. You stop grading decisions by whether they worked out and start grading them by whether your process and your confidence matched reality.
TL;DR:
- Maintaining a decision journal helps founders calibrate their judgment by tracking confidence levels and outcomes over time, rather than judging decisions solely based on results.
- The journal should include six core fields: decision, reasoning, expected outcome, confidence in percentage, base rate from past data, and mental state during the decision.
- Logging one decision per day for 30 days and reviewing regularly enables early detection of overconfidence and improves decision accuracy within three months.
- Using simple tools like spreadsheets or dedicated apps aids in consistent tracking and analysis of calibration gaps across different decision categories.
- Team rituals such as weekly reviews, monthly calibration summaries, and role assignments enhance collective learning and foster a culture of disciplined decision making.
What Is Structured Decision Making in a Decision Journal?
Structured decision making is the discipline of writing your reasoning down before an outcome is known, then reviewing it later with the outcome blind to your original prediction. It comes from Annie Duke’s idea in Thinking in Bets: every decision is a wager made with incomplete information, so judging it purely by result (what she calls “resulting”) teaches the wrong lesson. A smart pricing test can still lose. A reckless hire can still work out. The journal exists to separate the two.
Shane Parrish, who writes extensively about decision quality at Farnam Street, has long argued that the quality of a decision should be judged by the process that produced it, not the outcome it happened to produce. Philip Tetlock’s forecasting research backs this up empirically: people who state predictions as probabilities and track them over time become measurably better forecasters than people who reason in vague certainties. That is the entire mechanical trick behind a decision journal. You are not writing a diary. You are generating a data set about your own judgment.
Core Elements: The Six Fields Every Entry Needs
A decision journal entry only works if it captures enough detail to review honestly later. Decision journal templates built for this purpose consistently converge on the same core fields, because anything less makes the later review meaningless.
- Decision: the specific call you’re making, stated in one sentence.
- Reasoning: why you’re making it, including alternatives you rejected and why.
- Expected outcome: a concrete, checkable result, not a feeling. “Signups rise” is useless. “Signups rise 15% within 30 days” is a bet you can grade.
- Confidence: a probability, not a word. “I’m fairly sure” hides more than it reveals. “70%” can be tracked against reality.
- Base rate: what happened in similar past situations, pulled from your own history or a comparable reference class.
- Mental state: your energy, stress, and context when you made the call, because tilt shows up in the data over time.
Confidence expressed as a number is what unlocks everything else. Once you have a stack of 70%-confidence bets, you can check whether they actually won about 70% of the time.
Pro Tip: Write the expected outcome as a number and a date, always. “Better retention” is not gradable. “Retention up 5 points by March 31” is.
How to Run a Bet From Idea to Decided
A single bet moves through five stages, and each stage has a clear owner and a clear artifact. Here’s a pricing experiment run through the full cycle.
- Idea. A product lead proposes raising the starter tier price by $10. Reasoning, expected outcome (churn stays flat, revenue per account rises 12%), and an initial confidence (60%) go into the journal the day the idea surfaces.
- Prioritized. The founder tags it against other bets in flight, assigns a review date 45 days out, and confirms the metric that will decide it: net revenue per cohort, tracked weekly.
- Running. The price change ships to new signups only. Nobody touches the confidence number or the reasoning field again until the review date. That rule matters more than anything else in the process.
- Reviewing. On day 45, the reviewer reads the original reasoning first, blind to the actual result, and re-predicts the outcome. Only then do they reveal what actually happened. This three-step sequence exists specifically to expose hindsight bias before it can quietly rewrite the story.
- Decided. The bet closes as Won (revenue per account rose 11%, close enough to the target), Killed, or Inconclusive. The team logs one learning: base rate on price-sensitivity was roughly right, but the 60% confidence should have been higher given how thin the historical churn risk actually was.
That final note, the calibration gap, is the entire point of the exercise.
How to Start: Template, Tools, and a 30/90-Day Plan
Most people over-engineer their first attempt. Keep the entry itself under 10 minutes: decision, reasoning, expected outcome, confidence, base rate, mental state, review date. That’s it. One screen. Guides that studied this practice consistently land on five to ten minutes per entry as the sustainable ceiling, because anything longer gets skipped after week two.
Tooling matters less than people assume:
- Paper or a plain notebook: fast, private, but painful to search or aggregate later.
- A spreadsheet: easy to filter by confidence band, the fastest way to build your first calibration check.
- Notion or similar workspaces: good for teams that already live there, weak on structured review reminders.
- A dedicated decision journal app: built-in stages, review reminders, and calibration reporting without you assembling it yourself.
For the first 30 days, log one consequential decision a day, even a small one. Practitioners who tested this rollout found that logging frequency, not entry depth, drives the early learning curve. By day 30, run your first batch review. By day 90, you should have enough entries grouped by confidence level to see whether your 80% bets are actually winning 80% of the time.
Calibration: Measuring Accuracy and Avoiding Bias
Calibration is simple arithmetic once you have enough entries: group every closed bet by its stated confidence, then check the win rate inside each group. If your 70%-confidence bets have won 45% of the time, you’re overconfident in that range, and that’s worth knowing before your next roadmap bet, not after.
The check that actually catches you: pull every bet logged at 80% confidence or higher over the past quarter. If fewer than 8 in 10 closed as Won, your gut is running hotter than your evidence.
Founders hit the same handful of traps repeatedly:
- Resulting: crediting a lucky win to a great decision, or blaming a good decision for an unlucky loss.
- Hindsight bias: “I knew that hire wouldn’t work out” after the fact, when the original entry says otherwise.
- Motivated reasoning: writing a base rate that conveniently supports the founder’s preferred outcome.
- Tilt: making a call while exhausted or emotionally reactive, then rationalizing it later as sound strategy.
A base-rate field is the single strongest corrective for the inside-view overconfidence behind most of these. Pair it with a pre-mortem before any high-stakes bet, and a simple “wanna bet?” gut check whenever someone states a prediction with more certainty than the base rate supports.
Rituals That Make It a Team Habit
Individual journaling builds personal calibration. Team adoption builds institutional memory, and that only happens with rituals, not good intentions.
- Weekly: a 15-minute review of any bet hitting its review date that week. No blame, just reasoning versus outcome.
- Monthly: a calibration summary across the whole team, grouped by confidence band.
- Quarterly: a deeper post-mortem on the highest-stakes bets, with dissent explicitly invited before the verdict is recorded.
Assign roles early. Someone logs, someone runs the review, and someone is explicitly responsible for voicing the dissenting view so the loudest opinion in the room (the classic HIPPO effect) doesn’t quietly become the recorded reasoning. Team-level decision journals multiply the individual benefit precisely because the review becomes shared memory, not one person’s private notebook.
Pro Tip: Rotate who plays devil’s advocate each quarter. If the same person always argues the dissenting case, the team starts discounting them by default.
How This Compares to Decision Trees and Multi-Criteria Analysis
Decision trees map out branching choices and their probable payoffs before you commit, which makes them excellent for one-time, high-stakes forks like whether to enter a new market or shut one down. Multi-criteria decision analysis (MCDA) scores options against weighted factors like cost, risk, and time, which suits choices with several competing dimensions, like picking a vendor or a hire among finalists.
Both are pre-decision tools. They help you choose. Neither one tells you, six weeks later, whether your confidence was justified.
A decision journal picks up exactly where those frameworks stop. You can build a decision tree to choose between two pricing models, then log the chosen branch as a bet with a stated confidence and a review date. The tree helped you decide. The journal tells you whether you should trust the next tree you build. Founders who run dozens of small bets a year get more value from the review discipline than from any single upfront analysis, because the compounding insight comes from tracking many predictions against many outcomes, not from optimizing one choice in isolation. Treat the two as complementary: use a tree or MCDA scorecard when the choice is genuinely complex, and let the journal grade every choice, complex or not, after the fact.
Structured Decision Making in Practice Across Industries
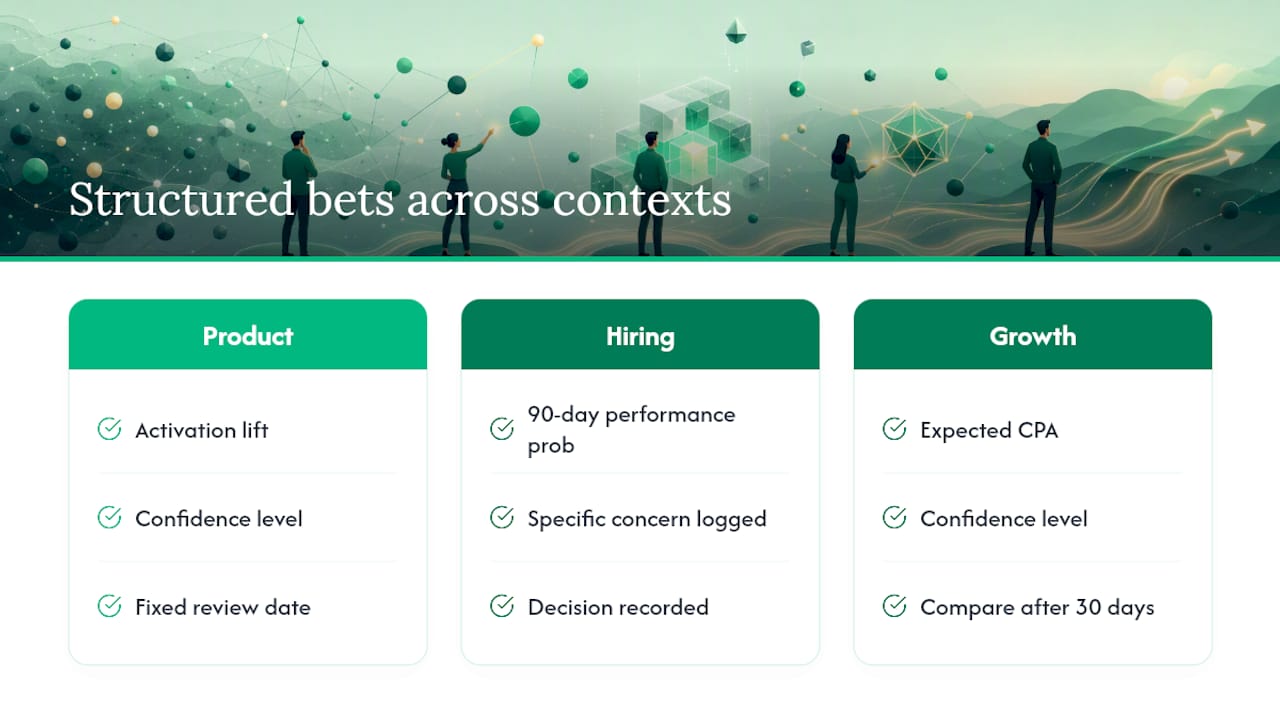
A seed-stage SaaS founder logging a churn-reduction bet looks almost nothing like a hospital administrator logging a staffing bet, but the mechanics hold up across contexts. A product team testing a new onboarding flow states an expected activation lift and a confidence level, ships to a cohort, and reviews on a fixed date rather than whenever the metrics happen to look good.
A hiring manager facing a borderline candidate can log the decision, the specific concern, and a 90-day performance expectation stated as a probability, rather than letting a hire’s early performance quietly rewrite the story of how confident anyone actually was going in.
Growth teams running paid acquisition tests are a particularly clean case, because the feedback loop is short. A team spending on a new channel can log expected cost per acquisition and confidence, then compare thirty days later, building a calibration record specific to that channel within a single quarter.
Consulting and facilitation contexts benefit too. Teams running structured stakeholder workshops, the kind strategy consultants use to align competing priorities before a big commitment, get more out of those sessions when the resulting decisions are logged as bets afterward rather than treated as settled once the workshop ends. The common thread across every one of these cases: the specific decision changes, the six-field structure and the review discipline don’t.
Where Data and Analytics Fit In
A decision journal is only as useful as the data you can pull out of it. Raw entries scattered across a notebook or a messy spreadsheet make it nearly impossible to answer the one question that matters: are your stated confidence levels tracking reality?
Analytics turn a pile of entries into a calibration curve. Group closed bets by confidence band, plot stated probability against actual win rate, and you get a visual gap between what you believe about your own judgment and what your track record actually shows. That gap is usually the most useful chart a founder never builds.
Beyond calibration curves, basic tracking answers operational questions too: how many bets are logged per week, what share actually get reviewed on schedule, and which categories of decision (hiring, pricing, product) show the widest confidence gaps. A team that skips reviews on 40% of its logged bets has a discipline problem long before it has a calibration problem, and that number only surfaces if someone is tracking review completion as a metric in its own right.
None of this requires sophisticated tooling. A spreadsheet with a pivot table gets you a usable calibration view. What it does require is consistent logging, because a calibration curve built from six entries tells you almost nothing, while one built from sixty starts to mean something real.
Common Obstacles and How to Get Past Them
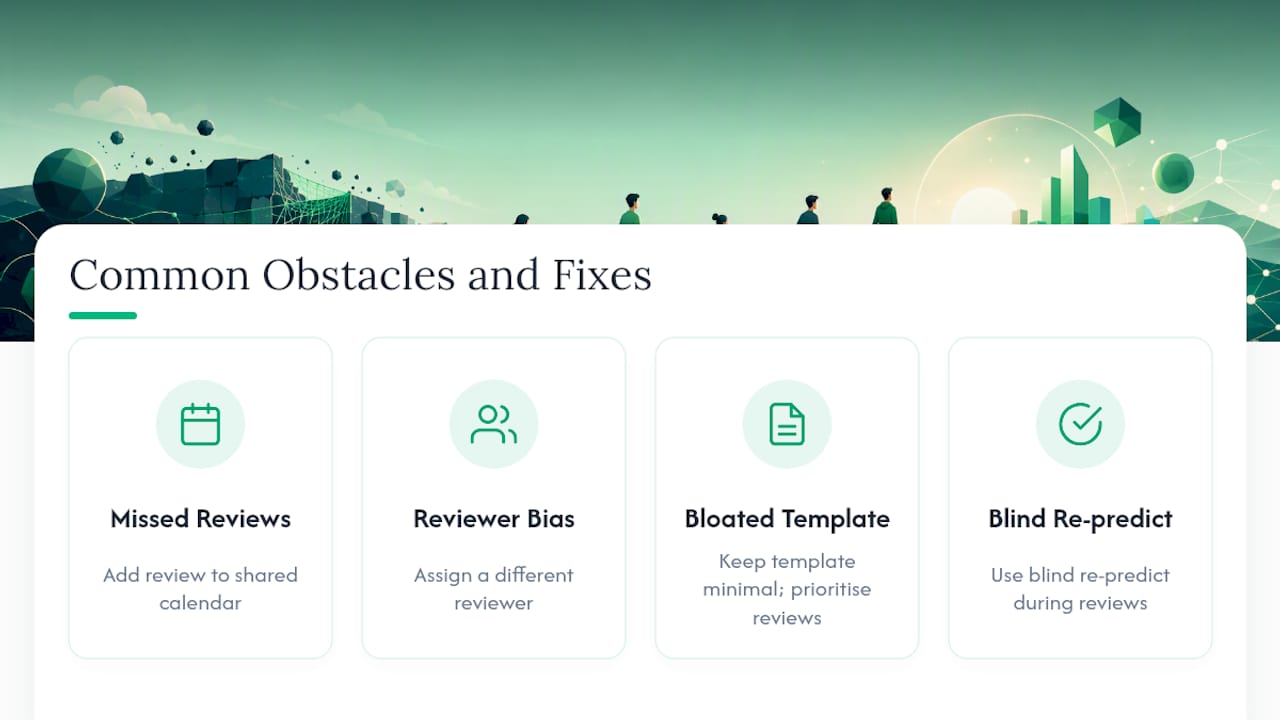
The biggest barrier isn’t the template. It’s the review. Teams start logging enthusiastically and then quietly stop reviewing on schedule, because reviews force an honest look at bets that didn’t work out, and that’s uncomfortable in a way that logging a new idea never is.
The fix is structural, not motivational: put the review date in the same calendar system as everything else that actually gets attended to, and treat a missed review as a process failure worth naming out loud.
A second obstacle is honesty under social pressure. If the founder’s pet idea gets reviewed by the same founder, the incentive to grade it generously is obvious. Assigning a different reviewer than the original decision-maker, even informally, catches this.
A third is over-scoping the template. Teams that try to capture ten fields per entry abandon the habit within a month. Practitioner guidance is consistent on this point: the discipline of reviewing on schedule matters far more than the sophistication of the template, and a bloated template is usually what kills the discipline first.
Finally, teams struggle to separate a bad process from a bad outcome, especially right after a loss stings. This is exactly what the blind re-predict step in the review protocol exists to prevent, and it’s worth defending that step even when someone wants to skip straight to “what happened.”
Adapting It for Yourself vs. Your Whole Team
A founder journaling alone can move fast and loose: log everything that feels consequential, review weekly, adjust confidence as patterns emerge. There’s no governance overhead because there’s no one else to align.
The moment a second person starts logging bets, you need agreement on definitions. What counts as “Killed” versus “Inconclusive”? Who has authority to close a bet? Without that agreement, your calibration data mixes incompatible judgment calls and becomes useless for comparing across people.
Individual use should stay lightweight and personal, closer to a private notebook than a formal system. Organizational use needs the opposite: shared fields, a fixed review cadence everyone respects, and a named owner for each bet so accountability doesn’t dissolve into “the team decided.” The team-level version of this practice uses the same six fields as the individual version. What changes is governance: who reviews whom, how dissent gets captured, and how calibration gets reported up rather than kept private. Start individually if you’re solo, but the moment you hire past two or three people, formalize the roles before the volume of bets outpaces your ability to track them informally.
Metrics That Actually Show Improvement
Three numbers matter more than any others for tracking whether this practice is working: entries logged per week, review completion rate, and the calibration gap itself (stated confidence versus actual hit rate, by band).
Entries per week tells you whether the habit is sticking. Review completion tells you whether the habit is honest, since a team that logs but never reviews is just journaling, not calibrating.
A fourth metric worth tracking informally: how often a post-mortem produces a learning that changes a future decision, versus one that just confirms what everyone already assumed. That’s harder to quantify, but it’s the difference between a journal that’s working and one that’s become a formality.
Why I Think Most Founders Get the First 90 Days Wrong
Most people trying this for the first time overload the template and get discouraged by month two. The fix isn’t more fields. It’s fewer, logged consistently, reviewed on a date nobody moves.
The bigger mistake is treating this as a way to prove decisions were good. It’s the opposite. The entire value comes from occasionally discovering a well-reasoned bet lost anyway, or a lazy one won by luck, and writing that down honestly instead of quietly editing the story afterward. Teams that can’t tolerate that discomfort get less out of the practice than teams that lean into it.
The objection I hear most from founders is “we don’t have time for this.” Fair, but the actual cost is 5 to 10 minutes per entry and 15 minutes a week for review. What it buys back is months of repeating the same misjudged bet because nobody wrote down why the last one felt so certain.
Treat your company’s strategy as a portfolio of bets, not a string of verdicts on people, and the whole practice gets easier to sustain.
— Cesar
Try the Workflow This Article Describes
A decision journal can be built around stages like Idea, Prioritized, Running, Reviewing, and Decided, with confidence expressed as a probability instead of a guess. Every bet closes with a post-mortem that separates skill from luck before hindsight has a chance to rewrite it.
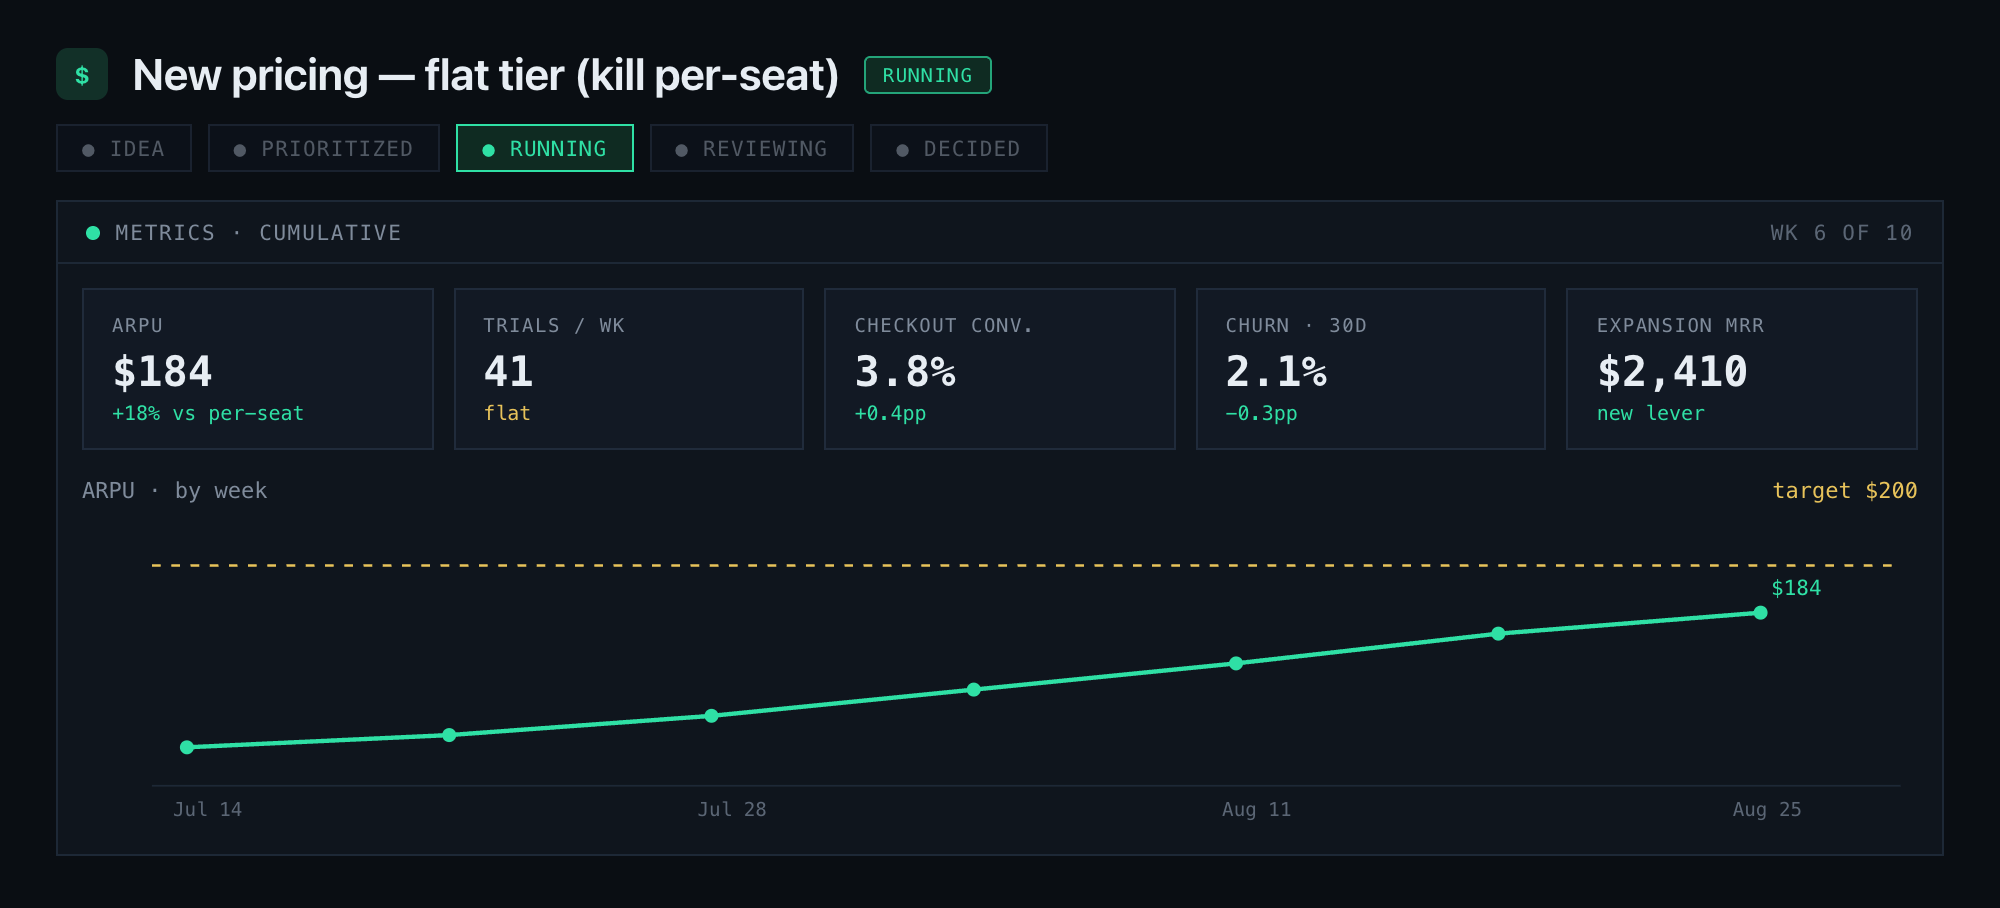
If you’ve been running this process on paper or in a scattered spreadsheet, the friction usually isn’t the template, it’s keeping the review dates and the calibration math from slipping through the cracks. Betlog handles both automatically, so your team’s confidence bands and win rates are always one click away instead of buried in old rows. Start a bet today: log one real decision your team is facing this week, set a review date, and see what your first honest post-mortem tells you.
Sources
- Decision journals | How to Think AI
- Decision journals: the practice, the science, the templates — Crucible
- Decision Journals: Track Your Thinking to Improve It · Expected Value
FAQ
What Is Structured Decision Making in This Context?
It means keeping a decision journal that records your reasoning, expected outcome, and confidence as a probability before you know the result, then reviewing it later to check calibration.
How Long Should Each Journal Entry Take?
Aim for five to ten minutes per entry using six core fields: decision, reasoning, expected outcome, confidence, base rate, and mental state.
How Do I Know If I’m Well Calibrated?
Group your closed bets by stated confidence level and compare that percentage to your actual win rate in that group; a large gap means you’re over or underconfident in that range.
What’s the Difference Between a Decision Tree and a Decision Journal?
A decision tree helps you choose between options before you commit, while a decision journal grades the choice you made after the outcome is known.
Can a Solo Founder Use This Without a Full Team Process?
Yes. Individual use can stay lightweight, a private log reviewed weekly, while team use needs shared field definitions and a fixed review cadence once more than one person is logging bets.